Completing the information cycle
Text mining, altmetrics and data sharing are all hot topics today. Sian Harris meets some of the people behind the raft of small technology businesses that collectively make up Digital Science
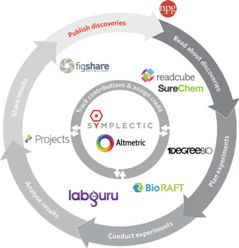
Timo Hannay has a diagram that he uses to show the role of information and data throughout the research process.
First, as his diagram shows, a researcher gathers insight into existing research to gain ideas and ensure that they build on, rather than repeat, prior research. Next, they begin to plan their research, looking into materials and equipment that they might need.
Once a research project is underway, it’s important to keep a good record of experimental processes and results, and perhaps to share those results with others.
The final stage – or the beginning of a new cycle of research – is the publishing of the research so that others can build on it, and the researcher’s reputation can be reinforced. This is the area that scholarly publishers traditionally sit in. Hannay himself was involved in this in his former role of director of Nature.com at Nature Publishing Group (NPG).
But times are changing. The role of information and data at other stages of the research cycle is increasingly interesting to publishers, and technology is being used more to integrate what were traditionally disparate roles. This trend is reflected in recent high-profile developments such as Elsevier’s purchase of the reference-sharing service Mendeley and Springer’s purchase of Papers last year.
And now the story comes back to Hannay and what he’s been doing since he left NPG.
His attitude at NPG, he said, was to see it as an information business. ‘Publishing is about information, not publications. Journals are a means to an end (communicating research),’ he explained. It is important, he continued, ‘to interpret that mission broadly and see it as full of opportunities, not threats.’
In January 2010 Hannay left NPG to become managing director of its new sister company, Digital Science. This was something of an anomaly within the parent company Macmillan as it is a software business rather than a publisher.
Hannay said Digital Science was created as a separate division for two reasons. Firstly, he said, the business needed a different set of skills, different people and a different culture. ‘NPG and Digital Science are complementary but different. We found it very difficult to realise the vision in NPG, which has a highly successful legacy business,’ he explained.
The other reason for the separation is pragmatic: ‘We work with other publishers and this is easier if we are not NPG.’
Digital Science’s approach is also very different. With the recognition of the need for different people and skill sets, the company has an unusual way of working. ‘One of the characteristics of us is that we are investing in very young start-up businesses, either through acquisition or equity investment,’ said Hannay, who ‘sits on lots of boards’. ‘We’re not a venture capitalist; we’re not looking to sell them. We are trying to build an operational business and this is the most effective way to do it. These are new skills for Macmillan, and the people who founded or created these products have sort-of self-selected themselves as having the right skills.’
As such, Digital Science includes many brands – the likes of Altmetric and Figshare – that have become well-known perhaps without people realising their Macmillan connection. However, Hannay observed that ‘Digital Science doesn’t feel like a portfolio company,’ adding that most of the businesses are based in Macmillan’s London or Boston offices and that there is increasing collaboration between the businesses.
Such collaboration is important in bringing together the different elements of Hannay’s diagram. ‘In a digital networked world we can reach researchers everywhere and we are trying to cover all these bases,’ he explained.
The first step of this process is gathering information. Obviously, one source is the usual published papers – and Digital Science’s Readcube can help with the process of collecting personal collections of information resources.
In addition, there are ways to get deeper insight than simply browsing or searching for papers in a particular topic.
One way to get further insight is through text and data mining across a vast body of published information. This is the role of two Digital Science businesses – one an acquisition and the other a very recently announced partnership.
SureChem was founded by Nicko Goncharoff in 2007 and bought by Macmillan Dec 2009 as a way to annotate content in the journals Nature Chemistry and Nature Biology.
The business has a particular focus on getting chemical information out of patents, a task that Goncharoff, who is head of knowledge discovery at Digital Science, described as ‘really difficult – the most challenging thing I’ve done in my professional life.’
He continued: ‘Patent documents are essentially dirty data sources. You have to get a name and then translate it to a structure so there is a lot of potential for errors. When we mine NPG journals there is the risk of false positives, but in patents we could miss things entirely,’ he said.
What’s more, many patent documents record generic compounds with an ‘X’ that could mean a wide range of substituent groups. This means that one patent claim could represent hundreds or thousands of compounds.
Despite the complexity, he sees patents as an important data source. ‘The reason we went into it was that there was a clear demand for this information. In chemistry, compounds can appear in a patent 18 months to five years before they appear in a journal (if they do at all). Because it’s automated, we can index patents within 24 hours of publication.’
Being part of Digital Science is helping to make this information available, he continued. ‘We can be more open with data (than we could as a startup). People are turning to open sources much more, but patent data has been separate.’
This changed, he said, with the news, at the end of 2012, that SureChem had deposited its entire chemical data into PubMed. ‘The idea was to make not just a gimmick, but something that is genuinely useful,’ he said.
SureChem operates with a freemium-type model, making useful content available for free but offering a paid version that provides extra features such as the possibility to narrow searches by molecular weight and export results. ‘We firmly believe that making it freely available will make some people want to buy premium tool,’ he concluded.
In March, Digital Science signed a two-year collaboration agreement with SciBite, a scientific news and alerts service for human health and drug discovery. The aim is to improve online research for the life sciences.
The agreement gives the companies access to each other’s content and text mining technologies. The partners will also explore ways to integrate the biology and data integration technologies and content of SciBite with that of SureChem’s patent chemistry products.
Lee Harland, founder of SciBite, commented at the time of the announcement: ‘SciBite was founded to open up biomedical intelligence to a wider audience. By partnering with Digital Science, we now have a way to connect the unique coverage of chemistry within SureChem to this rich biomedical data, and provide customers with a truly unique view of drug discovery and other life science research areas.’
‘SureChem has very impressive text mining. Since we acquired it we have wanted to incorporate it with biology,’ commented Hannay.
In the lab
The next stage in the research process takes place in the lab, and Digital Science has technology businesses in this area too. Firstly, Toronto-based 1DegreeBio assists scientists in determining which materials are available for research.
Laboratory safety and training is the focus of BioRAFT. Hannay confessed: ‘This is the one area we weren’t planning to get into, but we came across this business and realised that this process is mainly ad hoc today. We wanted to help scientists manage health and safety properly.’
When it comes to the actual experiments, Tel Aviv-based LabGuru provides what is essentially a lighter-weight, web-based equivalent of the type of laboratory information management systems (LIMS) that are used in commercial labs. As Hannay explained: ‘A LIMS is huge and corporate. This is more research-lab focused.’ As such, the business has also launched an iPad app.
In the longer term, Hannay said that he would like to see these businesses interacting. Linking tools for experimental processes with those keeping track of training on using equipment and materials used has obvious benefits.
Beyond experimental set-up, there is a new Digital Science business, called Projects, which Hannay described as a ‘desktop app for managing your data, analogous to iTunes’.
Data is, of course, a hot topic these days – and data sharing in particular. Hannay hopes that Projects will push to another Digital Science business, Figshare. Where Projects is like iTunes, Figshare is described as a ‘YouTube for data’.

Timo Hannay
Figshare began life when Mark Hahnel was doing a PhD in stem cell research at Imperial College, London. It was born out of his frustration that he produced lots of results, but only a fraction of those results were used in publication. He wondered whether other researchers could use these datasets, even if the results were negative.
Today Figshare has more than 100,000 datasets, stored in the cloud using Amazon Web Services. Users can see recently viewed or shared datasets and add categories and authors – and they can preview datasets so they can decide if they want to download anything. All datasets are given a DOI and there are tools to make it shareable and citatable.
‘There is an emphasis on share in the name. This is very important,’ said Aldo de Pape, business development manager.
However, ‘as nice as sharing is, it needs to have a business model.’ Perhaps surprisingly, this business has so far come from publishers. With an increasing interest in publishing and sharing datasets, publishers have been faced with a challenge: ignore data, incorporate it into their existing systems, develop systems, or work with partners.
‘The format that publishers offer is fairly limited, so publishers approached us and said that Figshare would be great place for them to visualise and store datasets,’ explained de Pape. The first such partners have been F1000 and Public Library of Science (PLOS). ‘If a dataset is too big and complicated to put on a publisher site, we put it on ours and send them coding to embed into theirs. Datasets take on the licence conditions of the paper they are in.’
The company is working on offerings for end users and institutions too. ‘We can’t take on endless datasets for free,’ noted de Pape. ‘Currently there is no paid-for offering for end users, but we see in the future a business model based on how much storage is used if the data is private rather than shared. We will still keep the emphasis on free sharing though.’
After the research and data gathering comes the publishing – an area that, as Hannay observed, is a different type of process. However, there are, of course, ways that technology can help too, specifically in the area of tracking what has been published and its impact.
‘One of the ironies about scientific research is that the way it is managed is very unscientific,’ observed Hannay. ‘Impact factors have a place but they are often used where it is inappropriate.’
Two Digital Science businesses have different roles to play in this part of the cycle.
Symplectic was already quite a mature company when Digital Science invested in it. The company was founded in 2003 by four PhD physics students at Imperial College, London, who saw that research published in their department was generally organised in quite an ad hoc way, and that admin was taking up a lot of researchers’ time.
Their solution was to build a centralised system that researchers can populate with their journal articles, books, grants and even things like TV appearances. For the researcher, this gives a record in one place, but for the institution it can give an overview of a department, a faculty or a type of publication.
Such a facility is important when universities or individuals are required to give evidence of their output to funders or governments. In 2008, Imperial and University College London used Simplectic’s Elements tool in the UK’s Research Assessment Exercise. In the 2014 Research Excellence Framework, the company will work directly with Research Councils UK and universities. It is also involved in the Performance Based Research Fund (PBRF) in New Zealand and the Higher Education Research Data Collection (HERDC) in Australia.
Elements also integrates with institutional repositories. It is built into Sherpa Romeo and can manage embargoes. According to Sabih Ali, the company’s marketing officer, it can bring in old databases that universities already have, including HR feeds, too.
In addition, there is Altmetric, which helps measure attention to individual research. ‘You always want to know how your work is doing,’ commented Euan Adie, founder of Altimetric. ‘Essentially we are trying to collect as much information as possible on papers and making this available to publishers, authors and readers.’
This means pulling together all the conversations in places like tweets, reviews and blogs, as well as in traditional citations, into one place. This is a complex process, especially, as Adie observed, because the timescales are different for different types of reactions.
‘Half of the tweets happen by day three and half the blogging happens within nine days. F1000 reviews and appearance in Mendeley occur on a longer time frame, and it is 18 months before citations really kick in.’
Another challenge is that it’s very difficult to evaluate if it’s good or bad attention. Adie noted that Altmetric did a project with Martin Fenner of PLOS, which revealed that two thirds of tweets were completely neutral.
What’s more, there are differences between subject areas, for example between archaeology and life sciences, in what constitutes attention. ‘What is really interesting is how much different areas engage in social media,’ he said.
Adie sees Altmetric as a way into raw data: ‘I see us as half engineering, half data curation. I’d like metrics to encourage people to see which papers to look at in more details. They could choose a type of attention, for example: of these 100 papers, which 10 have the most impact on government policy? It could help institutions pick things that fit with their remit.’
Despite the complexity, Altmetric does also attempt to quantify impact with the use of its doughnut symbol with coloured swirls around the sides to represent impact in different areas and a number in the middle to represent an overall score. And this symbol received a lot of Twitter discussion of its own when the company gave out real doughnuts at the STM Innovations seminar in London in December.
Integration
Hannay is excited about the individual businesses, but he is also excited about their potential when they work together. This is already starting to happen, with integration between LabGuru and Altmetric, and connections between Symplectic and Figshare, for example. But there is potential for more. As Hannay observed: ‘Once you are providing services all round you can in theory provide metrics all round.’
And there are possibilities beyond Digital Science too. Symplectic can connect to Mendeley – although not yet to Digital Science’s own Readcube. However, sister company Palgrave Macmillan uses Readcube with its Palgrave Pivot products.
There are possibilities with industry-wide initiatives too, such as bringing together the information from different stages of the research process with researchers’ unique ORCID identifiers.
The technology of the research process is changing and there are plenty of ideas of how to help.